Reports and recap
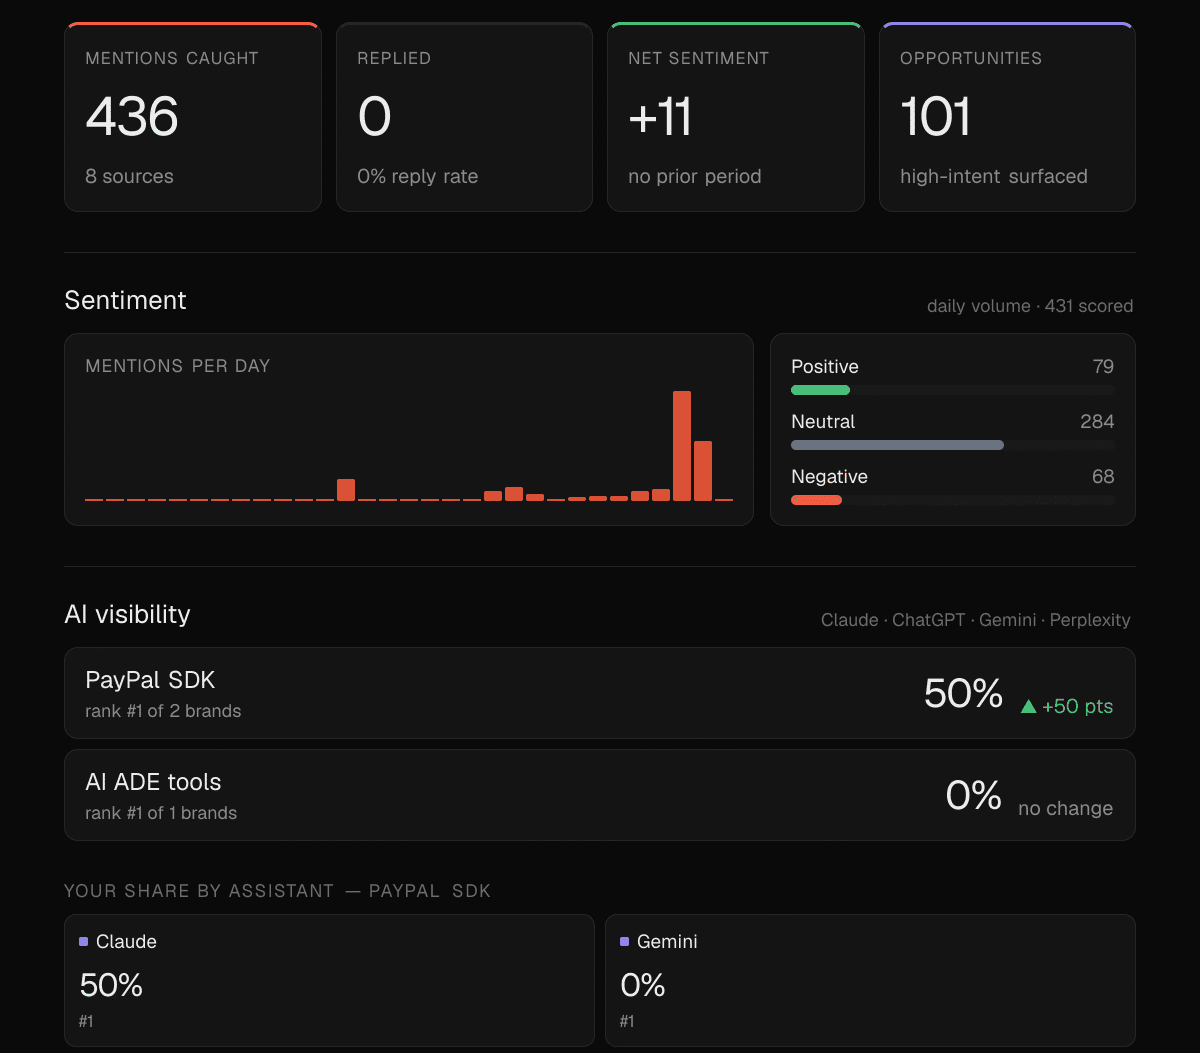
The Report is the whole workspace in one view over a stretch of time: how many mentions came in, how they felt, and where you stand in AI answers. Open it from Report.
Pick a period
Choose Day, Week, Month, or a Custom range with From and To dates. Preset periods have previous and next arrows plus a jump-to-latest button (Today, This week, This month), so you can step back through history or land on the current period.
What the report shows
- Headline counts: mentions Found, how many you Replied to, and your all-time Unread.
- Trend: the volume of mentions over the period, bucketed by hour, day or week to fit the span.
- Sentiment: the net sentiment number (positive minus negative) with its change versus the previous period, and the positive / neutral / negative split.
- AI share of voice: where you rank on each tracked topic, with a link to open AI visibility in full, and any AI events (rank changes, new competitors) you can review in the inbox.
- By source: a per-platform count so you can see which communities are talking.
The shareable recap image
Every report can be turned into a single recap image: a one-glance card with the mentions, sentiment, AI visibility and opportunities for that period, sized for Slack, a deck, or social.
Three controls sit under the report:
- Download recap image saves it as a PNG.
- Copy image puts the PNG straight on your clipboard to paste into a chat or doc.
- Preview opens the image in a new tab.
The recap is generated from the same period you are viewing, so switch to the week or month you want first, then download or copy. The image reflects only your own workspace and is scoped to your session.
Digests
The report is a pull. To get it pushed on a schedule, set up a personal email digest or a workspace Slack, Discord or webhook destination.